In September 2015, the “Agenda 2030 for Sustainable Development” was adopted by the United Nations General Assembly. The agenda contains 17 Sustainable Development Goals (SDGs) that were developed in a broad consultation and negotiation process and include social, ecological and economic challenges. All 193 member states of the United Nations signed the Agenda 2030 and thus committed themselves to implementing the SDGs.
In order to monitor progress towards the SDGs and inform policy makers, the 17 SDGs were further broken down into a set of specific targets for each individual SDG. In order to enable monitoring and evaluation of actions taken, a framework of indicators was developed for these 169 targets. Currently, this framework, developed by the Inter-Agency and Expert Group on SDG Indicators, contains 231 different indicators. While some of these indicators are already in use, for some indicators data are not regularly produced by countries yet.
The role of material use in the SDGs
The SDGs framework does not include an explicit goal on sustainable material use. However, our society, its production and consumption systems, and consequently economic progress and human well-being build upon the use of materials. With increasing material extraction, related environmental and social impacts are getting close or already trespassed natural boundaries compromising the resource needs of future generations. Hence, material use can, directly or indirectly, influence all Goals, and thus considering materials is essential for the accomplishment of all SDGs.
The contribution of raw materials to SDGs in different stages of the supply chain may be positive and/or have adverse impacts, depending inter alia on legislation and governance of countries or the technology used by companies. For instance the extraction of raw materials may result in greenhouse gas emissions. At the same time, these materials are needed for low-carbon energy technologies to combat global warming.
The next figure shows how material use may affect different SDGs along the various stages of the supply chain.
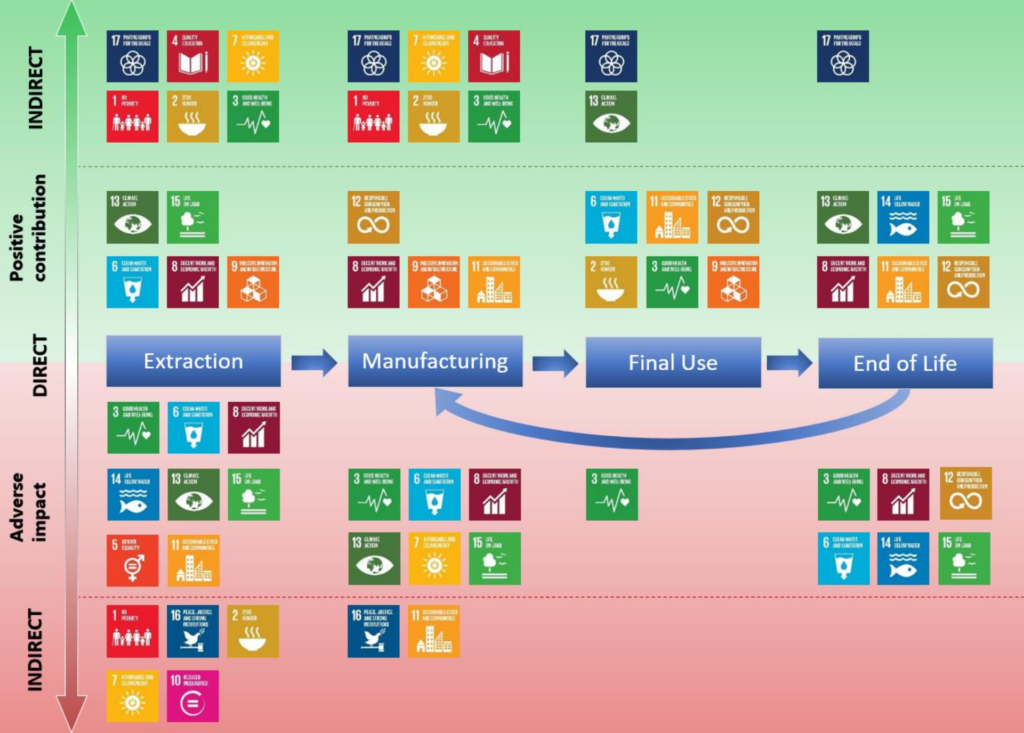
(Mancini L., Vidal Legaz B., Vizzarri M., Wittmer D., Grassi G. Pennington D. Mapping the Role of Raw Materials in Sustainable Development Goals. A preliminary analysis of links, monitoring indicators, and related policy initiatives. EUR 29595 EN, Publications Office of the European Union, Luxembourg, 2019)
In order to monitor progress on these goals, indicators derived from the Economy-Wide Material Flow Accounting and Analysis (EW-MFA) framework are used. EW-MFA is an internationally standardised method for the measurement and analysis of raw material use on the national level. The indicators contained in the SDG indicator framework are Domestic Material Consumption (DMC) per capita and per GDP and Material Footprint (MF, also called Raw Material Consumption, RMC) per capita and per GDP. Both of these indicators are used for monitoring target 8.4 on the improvement of resource efficiency in consumption and production and the decoupling of economic growth from environmental degradation. The same indicators are used to monitor target 12.2 on the achievement of sustainable management and efficient use of natural resources. For a comparison of the DMC and MF indicator see our specific story “The concept of material consumption”.
The material flow data set compiled for the UN International Resource Panel and made available on www.materialflows.net contains data for both the DMC and the MF indicator in absolute and relative terms. It therefore provides a unique source for monitoring progress of countries around the world towards achieving the SDG targets 8.4 and 12.2.
Comparing countries’ DMC per capita
The next figure shows an example of the DMC per capita indicator for countries worldwide in the year 2024. The DMC per capita varies significantly among countries. In 2024, Norway had the largest DMC per capita (55.5 tonnes), followed by Chile (54.8 tonnes per capita), and Canada (53.0 tonnes per capita). On the continental level, North America had the largest DMC per capita (26.2 tonnes) in 2024, while the values were significantly lower for Asia and the Pacific (13.5 tonnes per capita) and Africa (5.5 tonnes per capita).
Note: Hover over the countries to view the respective values. To access and modify this visualisation open it via the visualisation tool.
However, monitoring progress towards the achievement of the SDGs is about looking at trends and developments over time. The next figure shows the trends of DMC per capita for selected countries from 1970 to 2024.
Note: Hover over the graph to view the respective values. To access and modify this visualisation open it via the visualisation tool.
Looking at country-level trends from 1970 to 2024, for all countries worldwide a broad range of developments of the DMC per capita can be observed. For example in Brazil and Malaysia, DMC per capita increased by 147 % and 362 % respectively, reaching 20.0 and 20.8 tonnes per capita in 2024. DMC per capita in Ghana increased by 94 %, but only amounts to 9.5 tonnes per capita in 2024. In the same period, other countries, such as the United States of America or Cuba, showed a decline in DMC per capita by 23 % and 64 % respectively. In Cuba, DMC even decreased from 20.0 to 7.2 tonnes per capita. Decreasing trends in DMC indicate that an economy apparently requires less raw materials for its functioning.
Applying the MF indicator to correct for international trade effects
A country’s DMC may be lower if it outsources production, as indirect material flows associated with international trade are not considered by the indicator DMC. This is the case in Europe and North America. To correct for this distortion, the indicator material footprint (MF, also called RMC) also takes into account these indirect trade flows. It includes raw materials that are used as inputs along international supply chains. MF thus provides a more comprehensive picture of a region’s or country’s material consumption. For a comparison of the DMC and MF indicator see our specific story “The concept of material consumption”.
From 1992 to 2024, MF per capita has been increasing in almost all regions of the world. The biggest increase can be observed in Asia and the Pacific (from 6.1 to 13.4 tonnes per capita, 121 %). This is mainly due to the quadrupling MF of China, which increased from 6.1 to 25.8 tonnes per capita over time. In 2024, MF per capita was the highest in North America and Europe (30.4 tonnes per capita and 22.1 tonnes per capita respectively), whereas Africa with 4.5 tonnes showed the lowest MF per capita.
Note: Hover over the graph to view the respective values. To access and modify this visualisation open it via the visualisation tool.
The relation between the total amount of materials directly used by an economy, the MF, and economic activity (measured as GDP) within a country, is called “resource productivity”. Resource productivity and efficiency are key instruments for achieving sustainable management of natural resources. Therefore, they are part of many policies related to sustainable consumption and production, including SDGs 8 and 12, and complement other measurements of absolute material use.
Therefore, another political strategy for achieving sustainable management of natural resources, also rooted in the Agenda 2030, aims at the decoupling of economic growth from overall material use (MF), following the assumption that by that means also environmental impacts will be lessened. For more information, see our specific story on decoupling.