Countries differ considerably with regard to the extraction, trade and consumption of raw materials. Aspects like their raw material endowments or economic development influence the national material metabolism and are hence reflected in the different MFA indicators. Using Indonesia as an example, this story aims at showing the analytical options of the application ‘Country Profiles‘ to support discussions on a country’s raw material use and related sustainability issues on the basis of empirical evidence.
Country characteristics and economic development
Indonesia, an archipelago between the Indian Ocean and the Pacific Ocean, consists of more than 13,466 islands. It is one of the biologically most diverse countries in the world. With around half of Indonesia’s total land area covered by forests, whereof half (58 %) consist of primary forest, Indonesia has one of the world’s biggest and most important areas of tropical forests. Other important land use types are agriculture (35.2 % of land area) and wetlands (8.3 % of land area). (Global Forest Watch: „Land cover in Indonesia“, Data for 2015)
Also, the country’s population is characterized by high diversity: In 2019, Indonesia had a population of approximately 270 million consisting of around 633 ethnic groups.
Building on fertile land and rich resource endowments, the former Dutch colony experienced continued economic growth since the 1970s, except for the period after the Asian financial crisis from 1997 to 1999. In the period after its independence until the 1980s, resource extraction and commodity exports were the main generator of economic growth in Indonesia. After the 1980s, labour-intensive export-oriented manufacturing industries increasingly supported economic growth, leading to the industrialization of the economy. Today, Indonesia has become one of the world’s major emerging middle-income countries. This economic development patterns are also reflected in the MFA indicators of the country. (Rossotti, T. (2019): Indonesian Political Economy: A Historical Analysis, in: the rest: journal of politics and development, Vol. 9 (1))
Domestic material extraction and trade
In the period from 1970 to 2024, domestic extraction in Indonesia increased more than six-fold, from 358.5 million tonnes in 1970 to 2.7 billion tonnes in 2024. Hence, despite Indonesia’s increasing industrialization, its economy still heavily relies on material extraction. The next figures show the composition of domestic extraction by material group in 1970 and 2024.
Note: Hover over the graph to view the respective values. To access and modify this visualisation open it via the visualisation tool.
Both in 1970 and in 2024, the biggest share in extraction was attributed to the material category ‘Biomass’. However, it decreased from 85 % (303.7 million tonnes) in 1970 to 46 % (1.2 billion tonnes) in 2024. Also, the composition of biomass extraction changed significantly. In 1970, the largest category of biomass extraction was wood (48 %, 144.5 million tonnes). In 2024, extraction of wood declined to 8 % (97.4 million tonnes), while ‘crops’ became the dominant biomass material group (39 %, 303.3 million tonnes), with 62 % of it being attributed to oil bearing crops.
These data reflect that, over the last decade, cultivation of oil palm fruit experienced rapid growth in Indonesia. This can be explained by the fact that it enables a greater yield at lower cost per production than other oil bearing crops. Two types of oil, palm oil and palm kernel oil are derived from the oil palm fruit. They are used as cooking oil, in the production of food products and non-food products, such as cosmetics, as well as for biodiesel. At present, Indonesia is the world`s main producer of oil palm fruit (256.6 million tonnes in 2021) (Faostat 2023). The majority of its production is exported.
Another difference in material extraction between 1970 and 2024 is the role of the coal mining and metal extraction sector for Indonesia. In 1970, metal ores accounted for about 1 % (3.0 million tonnes) and fossil fuels for 12 % (43.7 million tonnes) of the total extraction. However, in 2024, metal ores accounted for 7% (180.3 million tonnes) and fossil fuels for 25 % (674.1 million tonnes). Among extracted fossil fuels, coal had the biggest share (87 %). Within the material category ‘metal ores’, copper and nickel ores were dominating extraction with shares of 31 % and 28 %.
These developments of extraction patterns from 1970 to 2024 reflect the process of industrialization in Indonesia. As economies develop, fossil fuels replace biomass (wood) as the most important source for meeting the energy demand and satisfy consumption needs. In parallel, trade activities as well as material consumption also experience an increase. The next figure shows the development of Indonesia’s material exports from 1970 to 2024.
Note: Hover over the graph to view the respective values. To access and modify this visualisation open it via the visualisation tool.
In the period from 1970 to 2024, exports increased 15-fold, from around 40 million tonnes in 1970 to almost 655 million tonnes in 2024. With a share of 69 % of fossil fuels and products from fossil fuels in total exports (or 451 million tonnes) in 2024, Indonesia was the world’s largest coal exporter. In 2024, another 12 % of exports amounted for biomass and products from biomass and 13 % for metal ores and products from metals.
Material consumption and productivity
History shows that increasing industrialization in a country leads to higher income levels and, as a consequence, higher consumption. This pattern is normally also reflected in a country’s material footprint or raw material consumptionThe indicator Material Footprint (MF, also called RMC) takes into account indirect flows. It thus captures the amount of domestic and foreign extraction of materials needed along all supply chains to produce the final products consumed in a country. (For more information, see our specific story on the concept of material consumption). Comparing resource consumption with economic performance (Gross Domestic Product, GDP), provides information about the material productivity of a country. The next figure shows the development of Indonesia’s domestic material consumption (DMC), material footprint (MF, also called RMC), GDP and material productivity (GDP/DMC and GDP/MF, respectively).
Note: Hover over the graph to view the respective values. To access and modify this visualisation open it via the visualisation tool.
For Indonesia, a slight growth in resource productivity can be seen between 1990 and 2024 for both consumption indicators DMC and MFWithin economy-wide material flow accounts, two indicators are distinguished to quantity materials used within an economic system.
Domestic Material Consumption (DMC) measures the total quantity of materials directly used within an economic system. DMC equals the sum of domestic extraction and imports minus exports in actual weight.
The indicator Material Footprint (MF) takes into account indirect flows. It thus captures the amount of domestic and foreign extraction of materials needed along all supply chains to produce the final products consumed in a country.. This means that GDP is increasing faster than material consumption – a phenomenon called “relative decoupling”. For more information, see our specific story on decoupling. The development of Indonesia’s raw material productivity is mainly driven by the steep increase of GDP. However, raw material consumption increased rapidly as well, but at a slightly slower pace.
Comparing the increase in MF in absolute values with per-capita values, one can see that the increase in MF is partly due to demographic developments (i.e. population growth). The other main driver of the increasing MF is the growth of GDP and resulting income and consumption levels.
Environmental implications and social consequences of material extraction
Indonesia’s economic success comes at a high environmental cost. The country has experienced far reaching land-cover changes over the past few decades. According to Global Forest Watch, in the period from 2002 to 2019, the area of tropical primary forest in Indonesia decreased by 9.48 million hectare or 10 %. Deforestation causes severe environmental degradation and biodiversity loss. In addition, through the release of greenhouse gas emissions, forest clearings influence global climate. Only since 2017, primary forest loss in Indonesia is starting to decline. (Global Forest Watch: „Land cover in Indonesia“, Data for 2015)
Recently, especially deforestation of the country’s rainforest associated with the expansion of oil palm plantations has drawn global attention. Deforestation driven by oil palm plantations showed its peak in 2009, afterwards it diminished. However, the overall rate of deforestation grew further, with the expansion of mining activities being one of the most important causes for most of the forest loss. (K.G. Austin, A. M. Schwantes, Y. Gu, P.S. Kasibhatla (2018): What causes deforestation in Indonesia?, in: Environmental Research Letters, Vol. 14 (2))
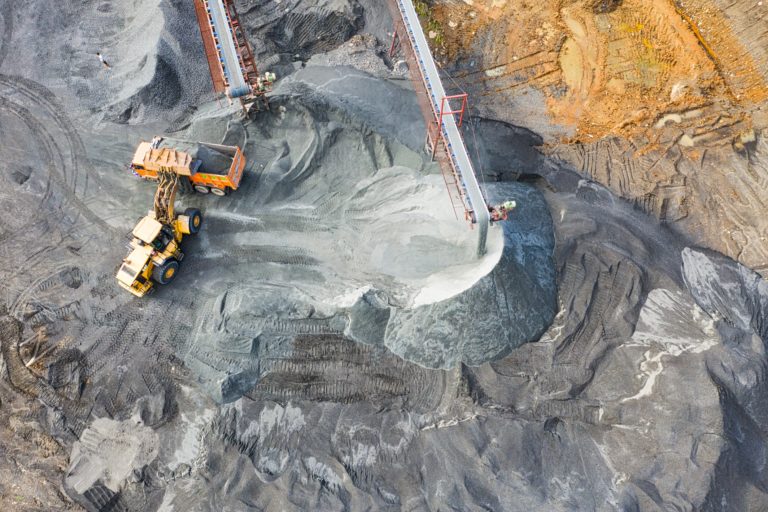
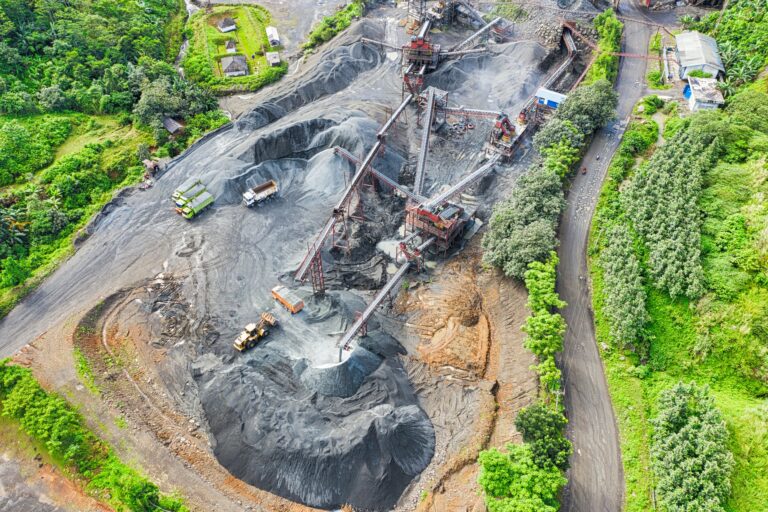
The importance of the mining sector for land use change can also be well-documented through analyzing satellite images. Indonesia has been a hot-spot for increased land use for mining purposes, in particular in the region of East Kalimantan, Borneo. You can explore the land used for mining activities with the visualisation tool of the FINERPINT project. (Maus, V., Giljum, S., Gutschlhofer, J., da Silva, D.M., Probst, M., Gass, S.L.B., Luckeneder, S., Lieber, M., MacCullum, I. (2020): A global-scale data set of mining areas, in: Nature Scientific Data (7), 289. DOI: 10.1038/s41597-020-00624-w.)
Besides the environmental consequences, deforestation also leads to a loss of livelihoods and social conflicts. Especially the mining sector in Indonesia is such a source of socioeconomic conflicts, often caused by the allocation of mining permits on lands of local communities to companies. It is also frequently linked to human rights abuse, forced work, or violations of mining worker’s rights. (B. Resosudarmo, I. A. Pradnja Resosudarmo, W. Sarosa, and N. L. Subiman (2009): Socioeconomic Conflicts in Indonesia’s Mining Industry)
As shown in this story, the application “Country Profiles” helps illustrating the raw material perspective of a country’s development path by means of compiling the most relevant visualizations as provided in the website’s Visualisation Centre.